CSLU2850.Lo1 Web Project 11
Assigned: April 23
Due: April 30
In this project we will:
- work with the Autocorrelation Function;
- work with Moving Averages;
- work with Exponential Smoothing;
Time Series
Autocorrelation Function
In the last project, we worked with Time Series and Lagged Values. We will now consider the
Autocorrelation Function, a way to examine any patterns that may exist between an observation and
its lagged values. It is similar to a correlation of a data series with its lagged values.
.
The general formula for calculating the autocorrelation for lagk, denoted rk, is:

Moving Averages
Moving Averages are a method to smooth the fluctuations of individual observations in a time series. To see if the
current observation is an improvement over the the previous observations, we can take the average of the previous observations and
compare that to the current observations. For the current observation, yn, where n > k, and the moving average with period k, y
ma(k), the
formula is:

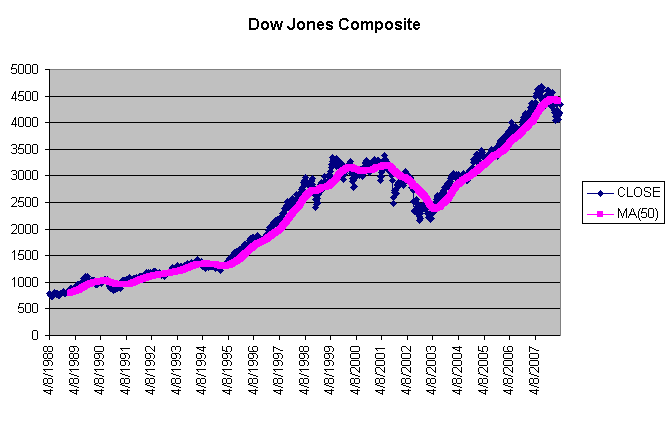
On the graph below, you can see how the Moving Averages smooth out the fluctuations in the Closing Prices:

Exponential Smoothing
Exponential Smoothing is another method of removing fluctuations between observations in a time series. Again, we will
use the lagged values of an observation, but now we will weight the prior observations in order of importance. Prior observations
that are closer in time to the current observation are given the heaviest weight; The weight of previous observations drops
off geometrically. Here is the formula for exponenital smoothing, where w is the weight to begin smoothing with:

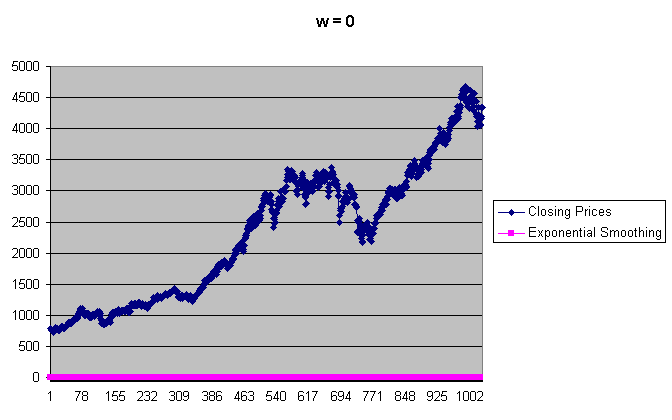
On the graph below, you can see how the exponential smoothing flattens the Closing Prices, for w = 0 (i.e. curve is completely smoothed):

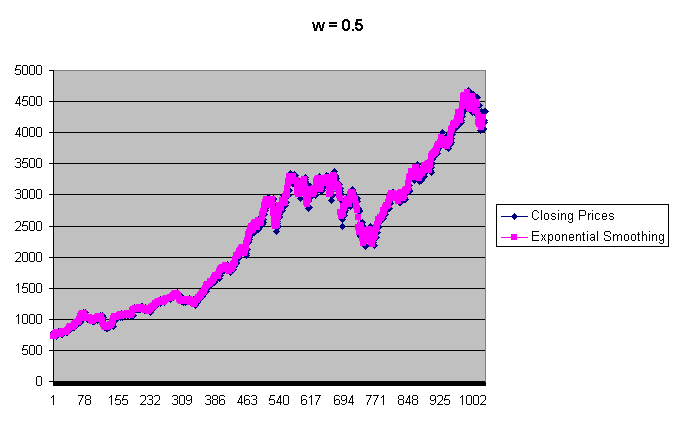
On the graph below, you can see how the exponential smoothing flattens the Closing Prices, for w = 0.5:

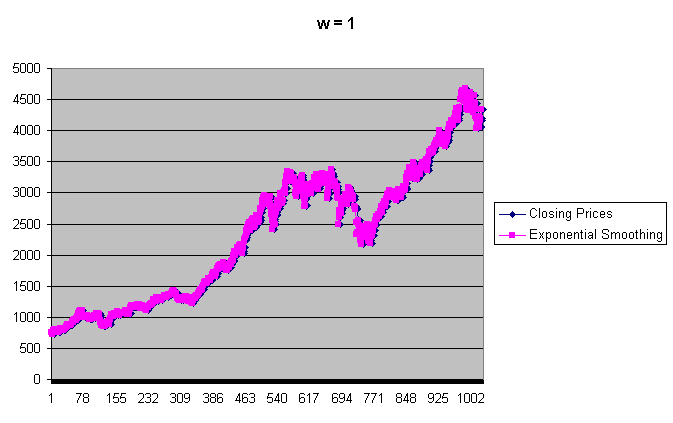
On the graph below, you can see how the exponential smoothing flattens the Closing Prices, for w = 1 (i.e. curve is not smoothed):

Deliverable
Auto Correlation Function
- Import this Tab-delimited text file,
Dow_Jones_Close.txt, into Excel. This file contains the Closing Prices for the Dow Jones Composite,
from 4/1/1988 to 4/1/2008.
- In step 1 of the Text Import Wizard Dialog, make sure to select Delimited.
- In step 2 of the Text Import Wizard Dialog, make sure to adjust the column separators, if Excel has made a mistake. If you miss this step,
then your Worksheet may have columns in the wrong place.
- Calculate rk, the Autocorrelation Function for lagk, for:
- k = 1;
- k = 2;
- k = 3;
- k = 10;
- k = 100;
Moving Averages
- Calculate the Moving Averages for the Closing Prices, with period:
- On separate graphs, plot the Moving Averages.
Exponential Smoothing
- On separate graphs, plot the Dow Jones Compositve Closing Prices against the same prices under Exponential Smoothing, for:
Make sure you have labeled your charts neatly and appropriately. Also, make sure all of your charts are visible
in your Workbook. Once you have completed all steps, save your Workbook as Project11.xls. You should email
your instructor this .xls file.


